# Plant Overview
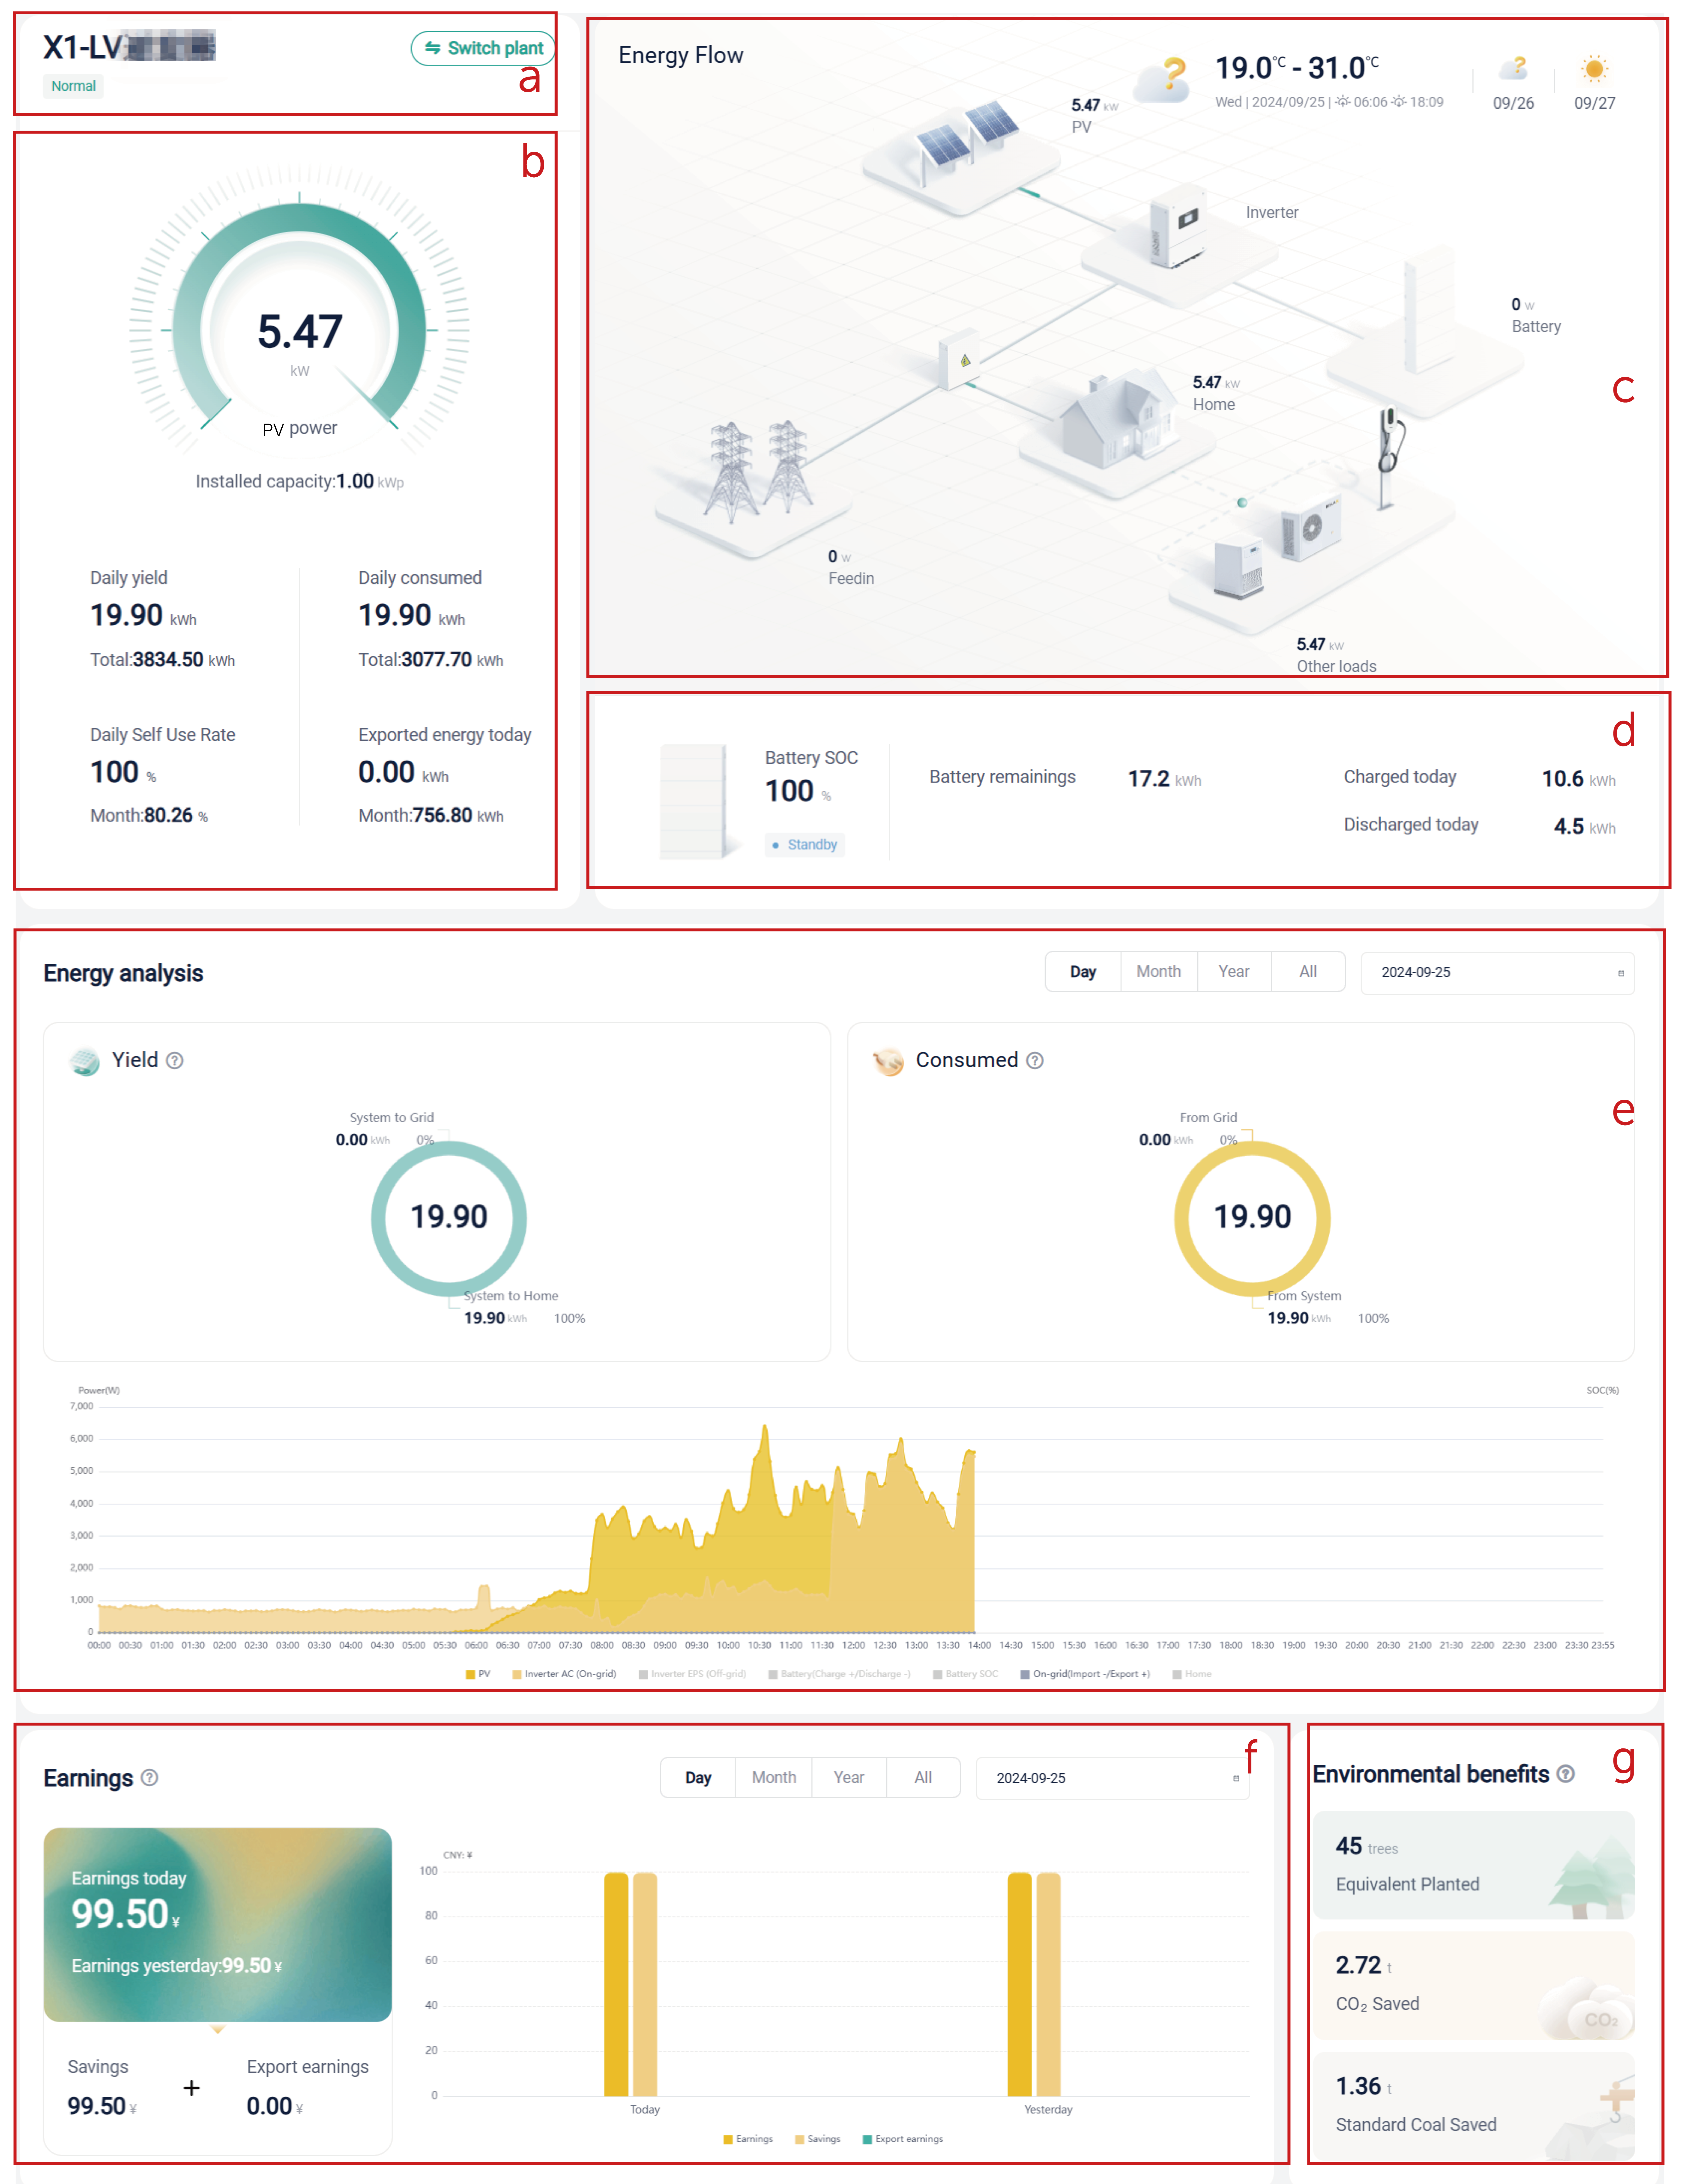
After login to SolaXCloud, you will see the overview page of a plant. The plant is the default plant. For details about how to set a plant as default, see Set as Default in Plant Management.
The following takes a plant as an example to describe the composition and functions of the overview page.

| SN | Description |
|---|---|
| a | This area displays:
|
| b | This area displays the statistics of the plant, including PV power, installed capacity, daily and total power yield, daily and total power consumed, daily and monthly self use rate, power exported to grid today and monthly. Click  beside each field to view its definition. beside each field to view its definition.
|
| c | This area displays
|
| d | This area displays the situations of battery, including battery SOC, battery status, charged/discharge today, battery remaining, and estimated remaining hours. |
| e |
|
| f | This area displays the earnings of the plant in the dimension of All, Year, Month, and Day. The indicators are Export earnings, Savings, and Earnings. Earnings = Savings + Export earnings. If a heat pump is connected to the system, Savings="Electrical charges saved by means of PV power generation"+"Electrical charges saved by heat pump". The indicators in the horizontal axis can be shown optionally. |
| g | This area displays the contributions made by the PV power generation to the environment. The measurement indicators are CO2 avoided, equivalent trees planted, and standard coal saved. |
[!Note]
- In the time dimension, "All" refers to the time since the plant has been created.
- Only when the tariff is set can the system calculate the earnings of the plant.
- CO2 avoided: The amount of CO2 emitted by burning fossil fuel to produce the same amount of power generated by the plant.
- Equivalent trees planted: The number of trees that can absorb the amount of CO2 avoided by the plant.
- Standard coal saved: The amount of standard coal needed to produce the amount of PV power generated by the plant.

