# Overview
This section introduces composition of Overview and details of each component.
The table below is detailed introduction of Overview:
| Serial Number | Name | Description |
|---|---|---|
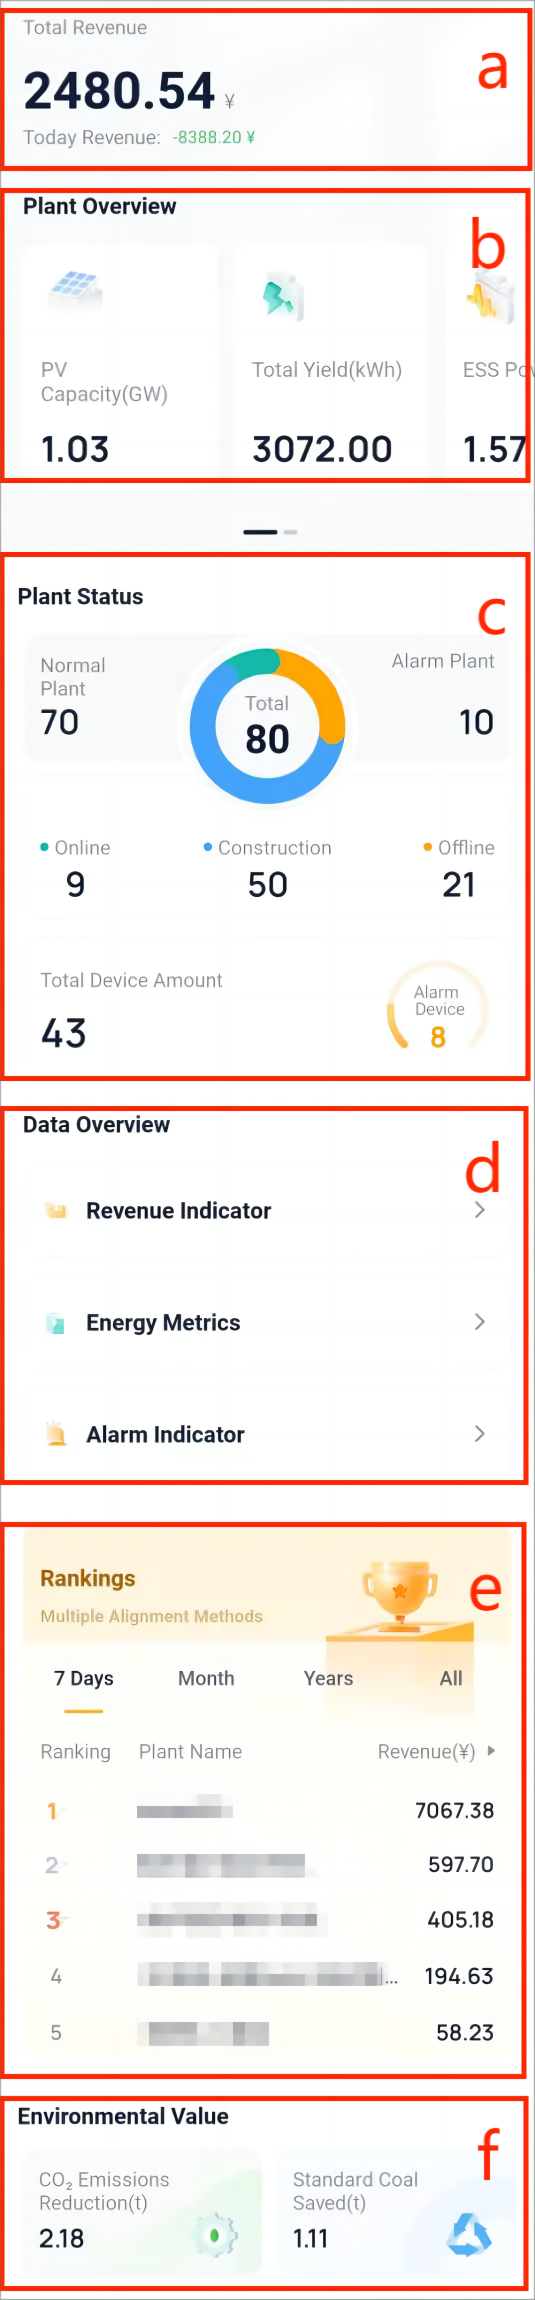
| a | Revenue | This area displays: the total revenue of all plants today and the accumulated revenue of all plants since devices of the plants are registered at the SolaXCloud. |
| b | Plant Overview | This area displays the overall situations of all plants under the current account, including PV Capacity, Total Yield, ESS Power, Total Charge, and Total Discharge. Slide icons to the left or right, to view all data. |
| c | Plant Status | This area displays: plant running status, plant connection status, and device running status.
|
| d | Data Overview | This area displays revenue indicator, energy metrics, and alarm indicator. By tapping them, you can view more detailed information.
|
| e | Rankings | This area displays the ranking of all plants. Users need to set the keyword and time dimensions.
|
| f | Environmental Value | This area displays contribution made by users through the SolaX Power products. |
 , to select a keyword from the drop-down menu. Keywords includes: Revenue, charge, discharge, yield, and alarm number.
[!NOTE]
- In the time dimension, All refers to the period from the time a device first reports the data to the present.
- PV capacity: The sum of rated power of all PV modules.
- ESS power: The sum of rated power of all energy storage inverters.
- Feed in: Users sell surplus power to an electric power company.
- Yield: The amount of power generated by the PV inverter.